Note
Click here to download the full example code
Annotate celltypes
An example workflow using the PBMC3k dataset included with besca illustrating how to annotate celltypes based on leiden clusters. This workflow begins with a preprocessed and filtered dataset. Please refer to other tutorials on how to perform these steps.
This shows how to dipslay diffrent markers genes, assign the clusters and if need be to recluster on mixed cluster. For PBMC dataset we advised the user to work using the sig-annot or auto-annot procedures which is automated, less error-prone, and allow for standardized annotations across datasets.
This is well illustrated in the tutorials (see Notebook 2 )
import random
# load libraries
import besca as bc
import scanpy as sc
import pytest
# pytest.skip('Test is only for here as example and should not be executed')
random.seed(1)
# load preprocessed dataset (included in BESCA for demonstration purposes)
adata = bc.datasets.pbmc3k_filtered()
# need to drop celltype annotation stored in this dataset (only relevant for this tutorial)
adata.obs.drop(columns=["leiden"], inplace=True)
sc.tl.leiden(adata)
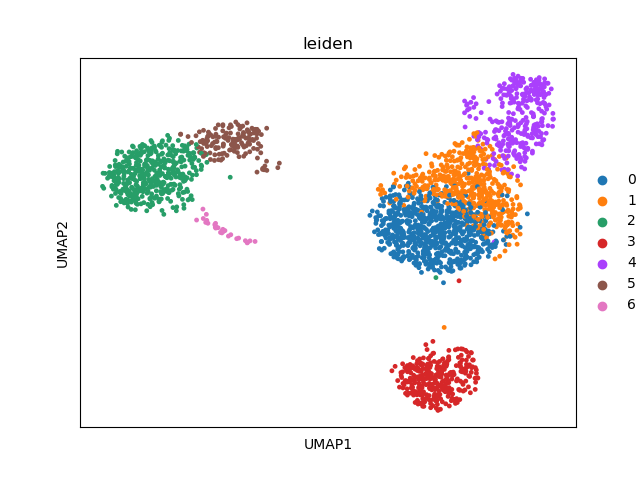
# visualize the leiden clusters
sc.pl.umap(adata, color=["leiden"])
visualization of marker genes
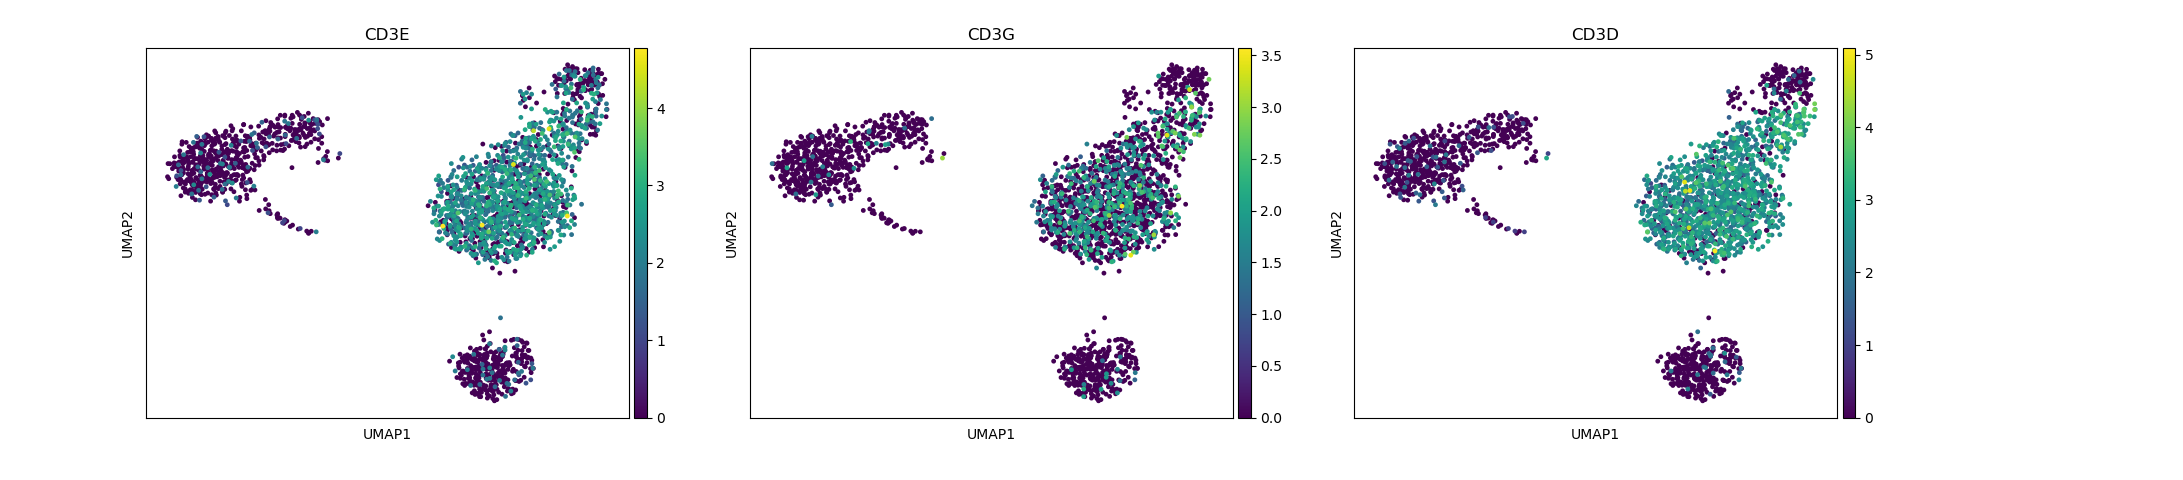
Depending on the type of data you are analysing you will need to look at different marker genes that are specific to the celltypes you would expect to find in your dataset. In this case we are looking at PBMC cells and will try to identify the main Immunecell subtypes: T-cells, B-cells, Monocytes, and Dendritic cells.
# identification of T-cells
sc.pl.umap(adata, color=["CD3E", "CD3G", "CD3D"])
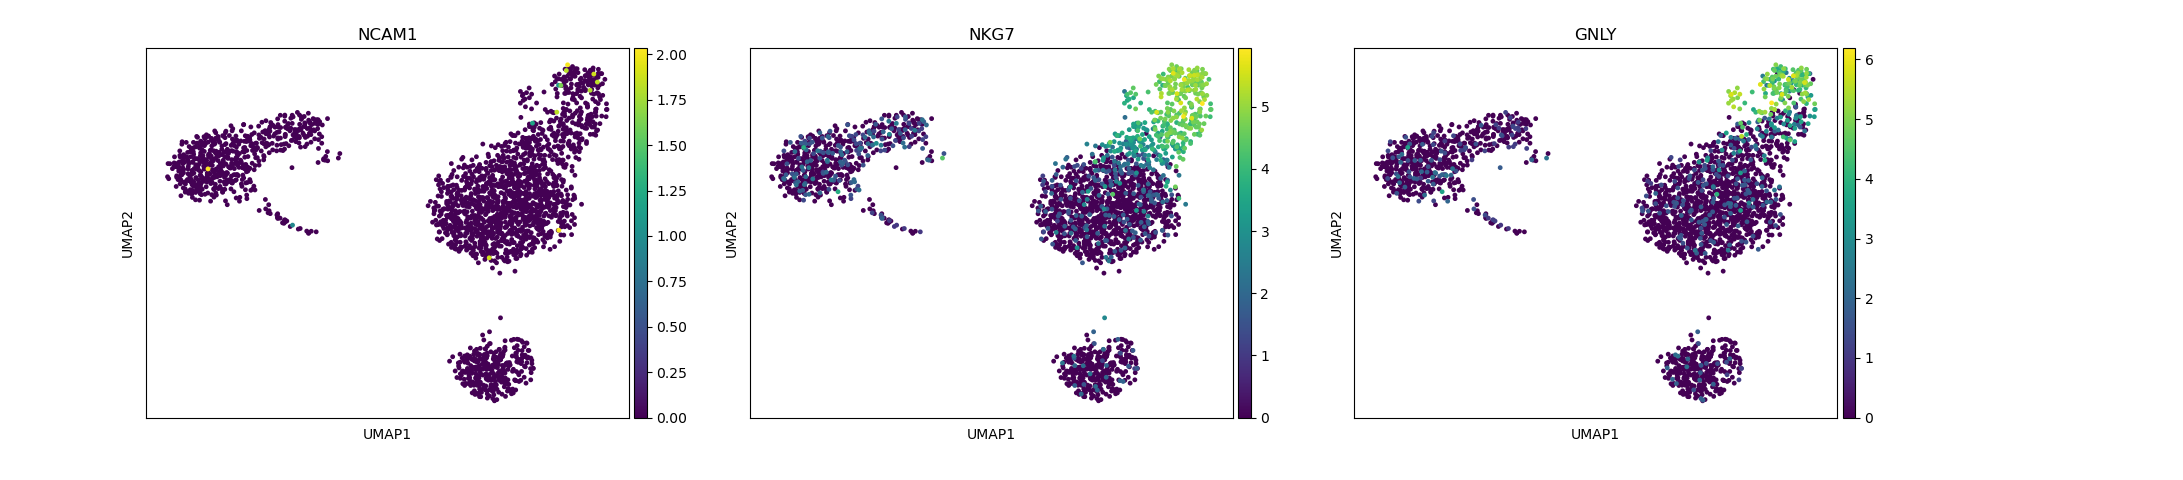
# identification of NK cells
sc.pl.umap(adata, color=["NCAM1", "NKG7", "GNLY"])
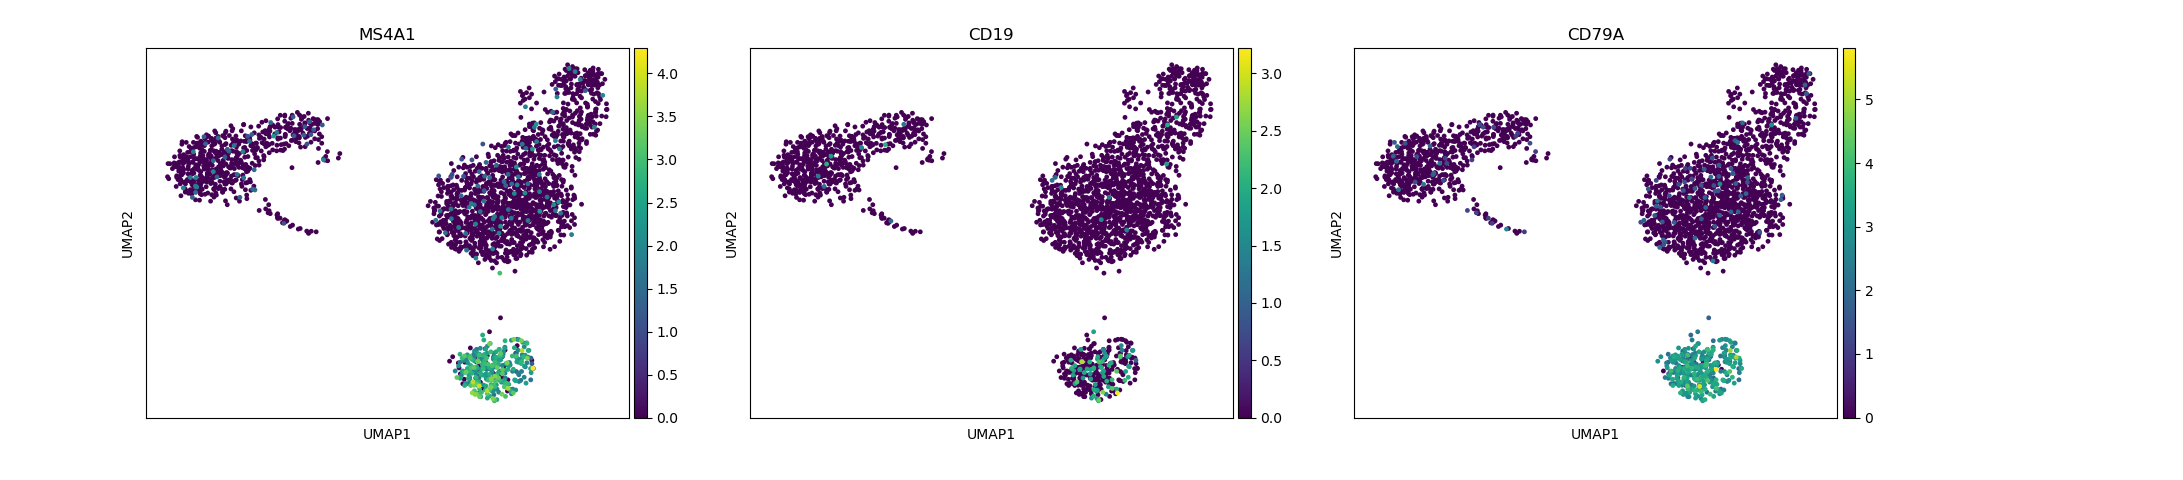
# identification of B-cells
sc.pl.umap(adata, color=["MS4A1", "CD19", "CD79A"])
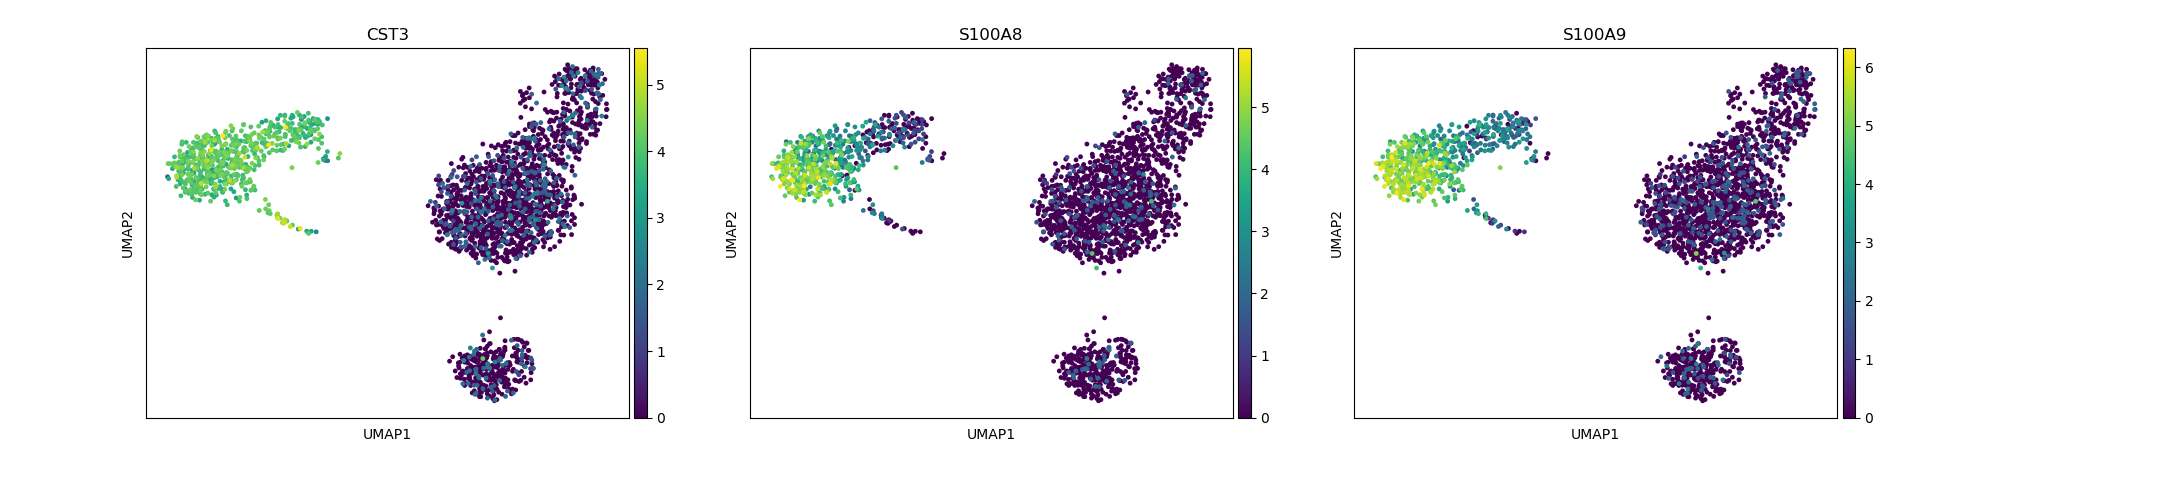
# identification of myeloid cells/dendritic cells
sc.pl.umap(adata, color=["CST3", "S100A8", "S100A9"])
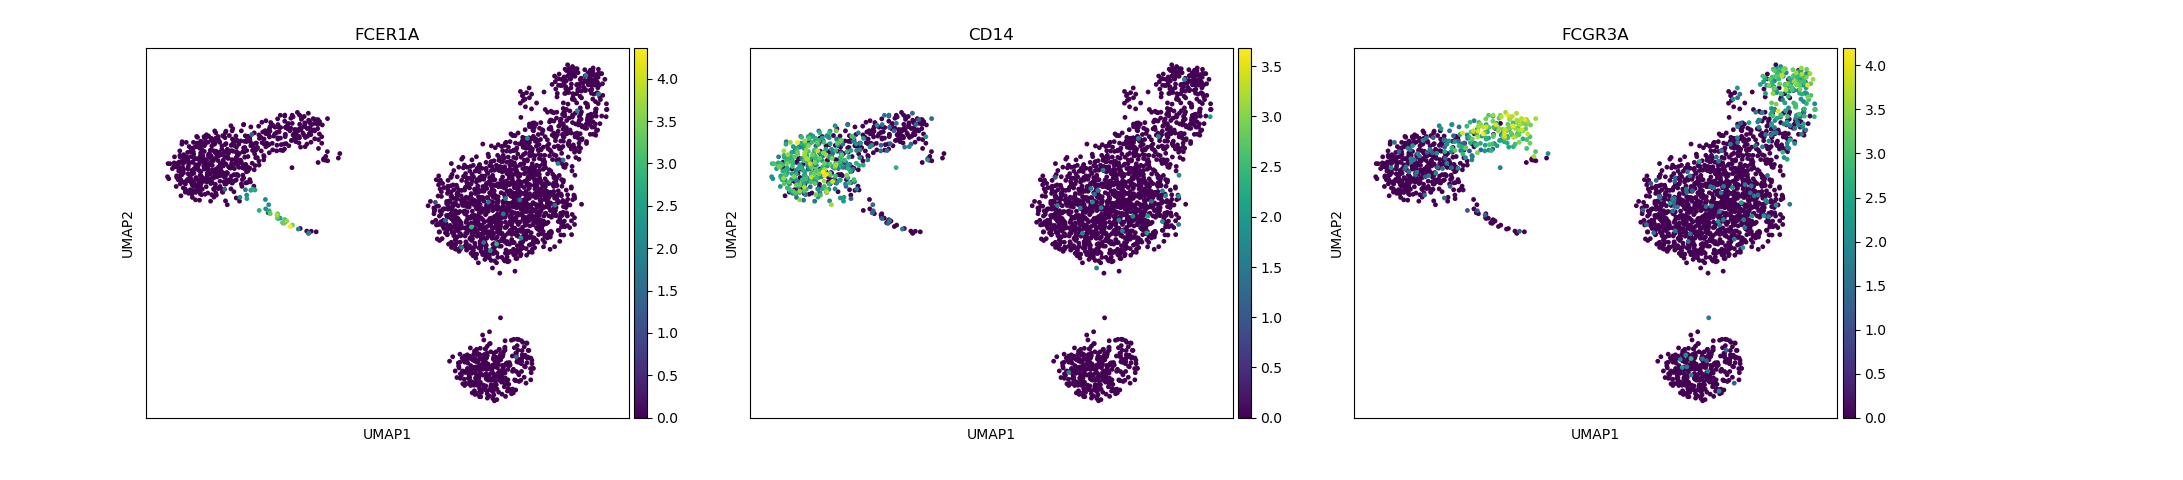
# identification of dendritic cells(FCERIA) and monocytes
sc.pl.umap(adata, color=["FCER1A", "CD14", "FCGR3A"])
cluster level celltype annotation
Depending on how fine-grained your clustering is you will often come into the the situation that a leiden cluster contains several cell-populations that are clearly segregated based on the marker gene expression. If this happens you can try and adjust the leiden resolution parameter to make the clustering more fine-grained, but this will not always be successfull. Especially in cases where your sample contains vastly different celltypes (e.g. an Immuncell dataset containing B-cells and T-cells) it will be difficult to resolve T-cell subsets since they are much more comparable to each other than e.g. a T-cell vs a B-cell. In this case it often makes sense to make a highlevel cell-labeling and then perform a second clustering on onoly the mixed cellclusters. This is the procedure that will be demonstrated in the rest of this tutorial.
# define high-level celltype annotation
new_labels = [
"Tcells", # 0
"CD14+ monocyte", # 1
"mixed", # 2
"Bcells", # 3
"Tcells", # 4
"FCGR3A+ monocyte", # 5
"pDC", # 6
] # 7
bc.tl.annotate_cells_clustering(adata, new_labels) # ISSUE is in this method
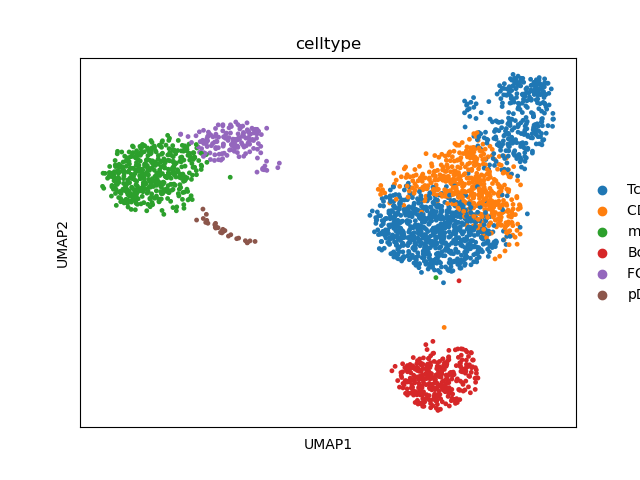
# visualize annotation
sc.pl.umap(adata, color=["celltype"])
# preserve highlevel labels for future use if desired
adata.obs["high_level celltype"] = adata.obs.celltype.tolist()
reclustering on mixed cell clusters
# perform reclustering on subset using besca function
adata_subset = bc.tl.rc.recluster(
adata, celltype=("mixed", "Tcells"), celltype_label="celltype", resolution=1.3
)
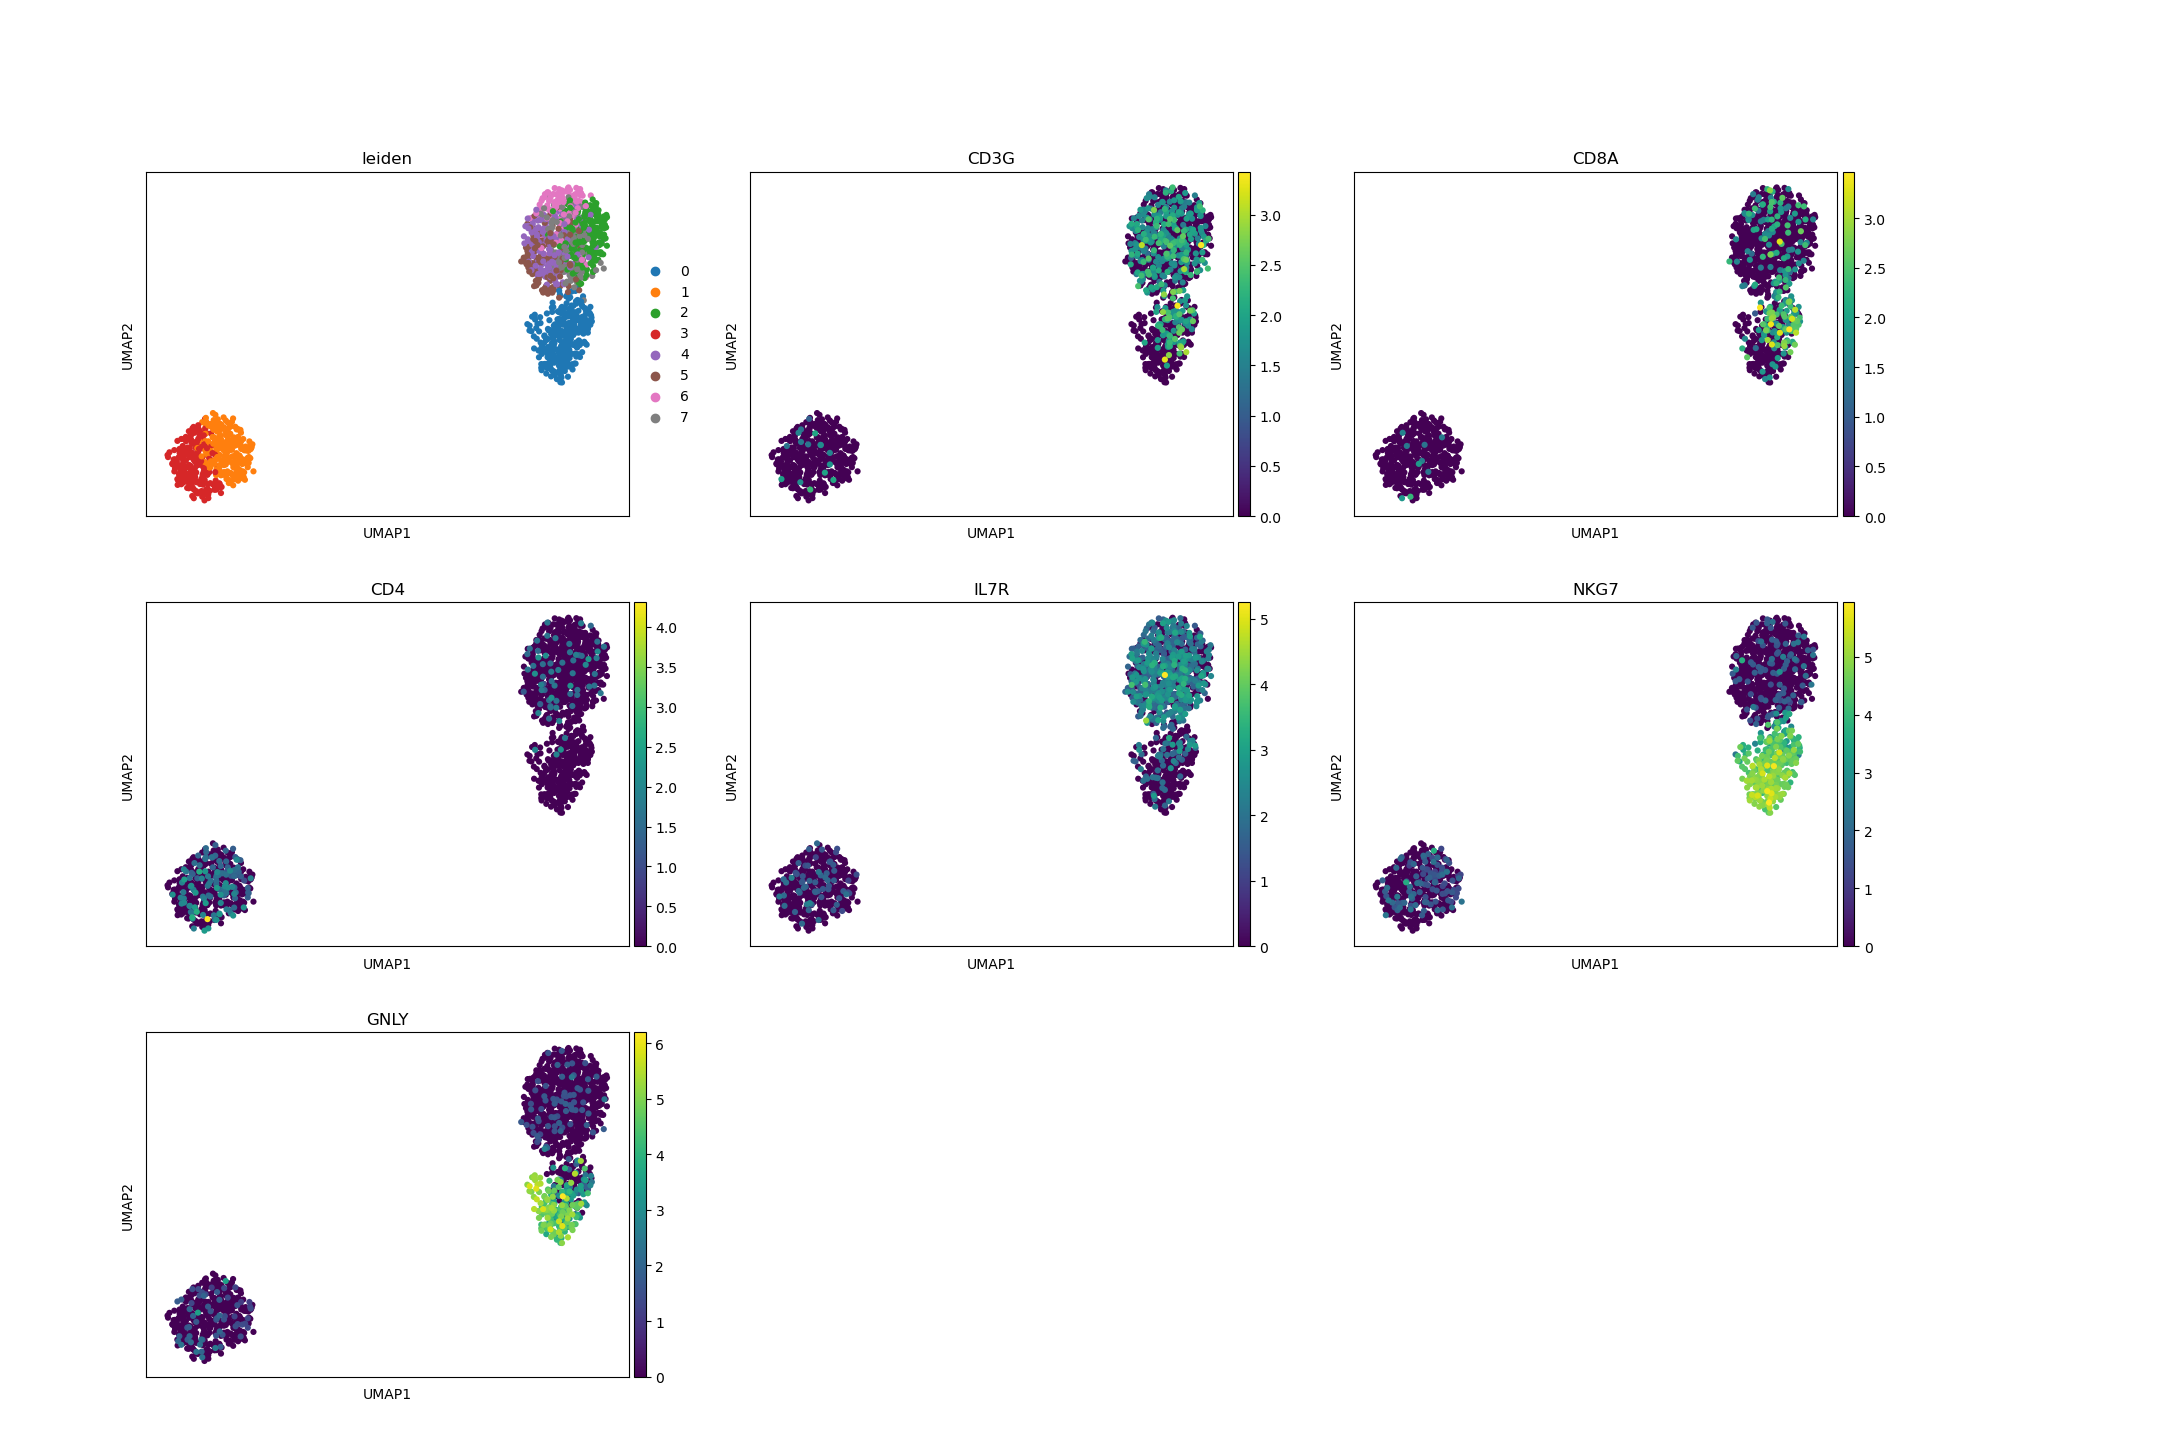
# visualize important marker genes in reclustering
sc.pl.umap(
adata_subset,
color=["leiden", "CD3G", "CD8A", "CD4", "IL7R", "NKG7", "GNLY"],
ncols=3,
)
print(adata_subset.obs.get("leiden").value_counts().index.tolist())
# annotate celltypes based on the new leiden clusters
labels = [
"NK cell", # 0
"CD4 T-cell", # 1
"CD4 T-cell", # 2
"CD4 T-cell", # 3
"CD4 T-cell", # 4
"CD8 T-cell", # 5
"CD4 T-cell", # 6
"CD8 T-cell", # 7
"CD4 T-cell", # 8
"CD4 T-cell", # 9
"CD4 T-cell", # 10
"CD4 T-cell", # 11
"CD4 T-cell", # 12
"CD4 T-cell", # 13
"CD4 T-cell", # 14
"CD4 T-cell", # 15
"CD4 T-cell", # 16
"CD4 T-cell", # 17
"CD4 T-cell", # 18
"CD4 T-cell", # 19
"NK cell", # 20
]
new_labels = [
labels[i]
for i in range(len(adata_subset.obs.get("leiden").value_counts().index.tolist()))
]
# merge new celllabels back into the original adata object containing all cells
# Note: this will overwrite the labels contained in adata.obs.celltype! If you w
bc.tl.rc.annotate_new_cellnames(adata, adata_subset, names=new_labels)
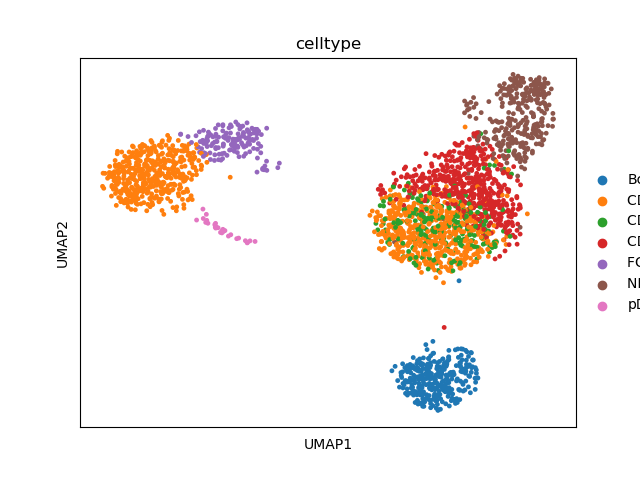
# visualize finished celltype annotation
sc.pl.umap(adata, color=["celltype"])
['0', '1', '2', '3', '4', '5', '6', '7']
Total running time of the script: ( 0 minutes 3.793 seconds)