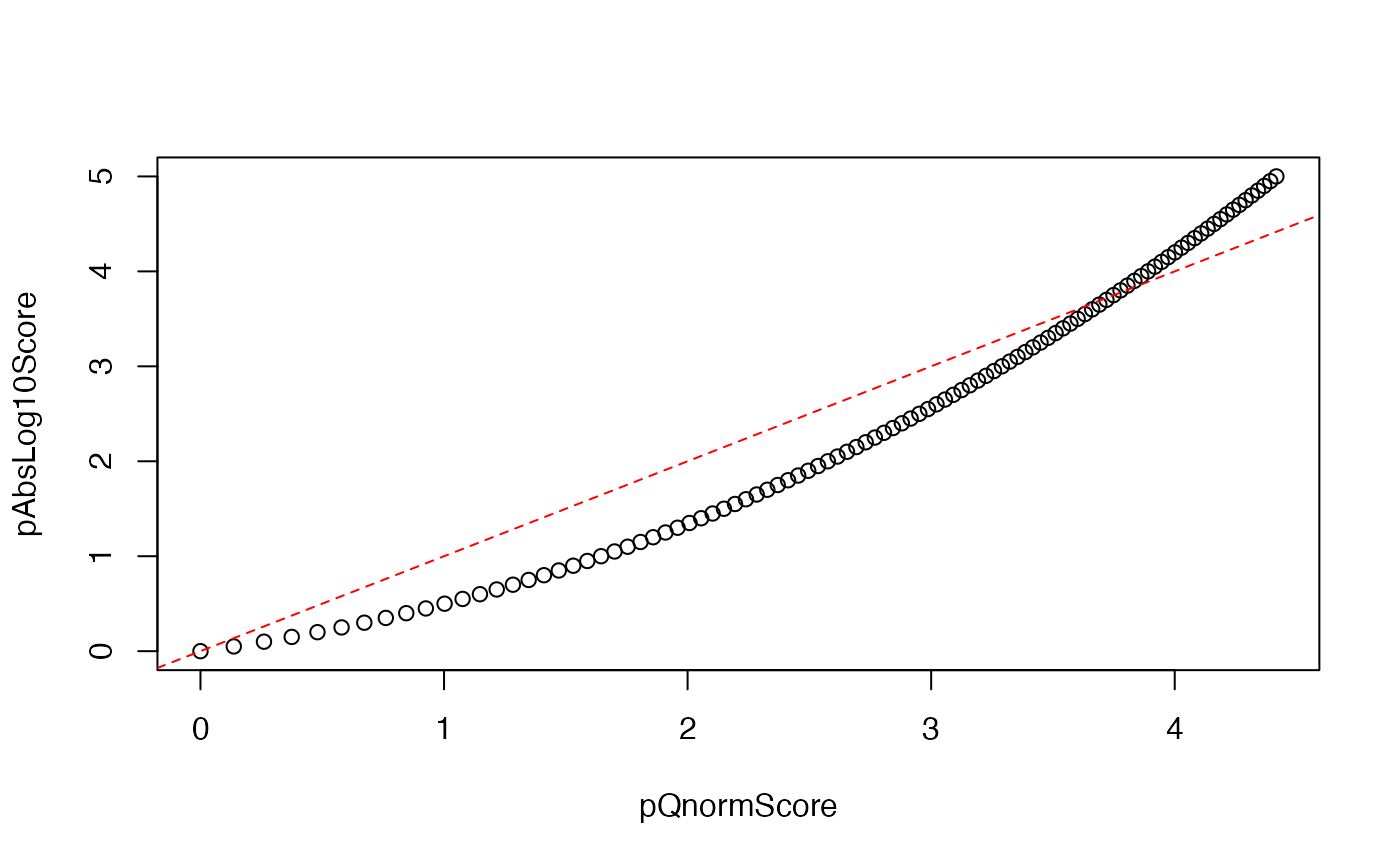
The function wraps other functions to map p values ranging on \((0,1]\) to continuous scores ranging on \(R\) in a number of ways.
Usage
pScore(p, sign = 1, method = c("qnorm", "absLog10"), replaceZero = TRUE)Arguments
- p
p-value between (0,1]
- sign
Sign of the score, either positive (in case of positive numbers), negative (in case of negative numbers), or zero. In case a logical vector,
TRUEis interpreted as positive andFALSEis interpreted as negative.- method
Currently available methods include
qnormandabsLog10.- replaceZero
Logical, whether to replace zero p-values with the minimal double value specified by the machine. Default is
TRUE. If set toFALSE, results will contain infinite values.
Examples
testPvals <- c(0.001, 0.01, 0.05, 0.1, 0.5, 1)
pScore(testPvals, method="absLog10")
#> [1] 3.00000 2.00000 1.30103 1.00000 0.30103 0.00000
pScore(testPvals, method="qnorm")
#> [1] 3.2905267 2.5758293 1.9599640 1.6448536 0.6744898 0.0000000
testPvalSign <- rep(c(-1,1), 3)
pScore(testPvals, sign=testPvalSign, method="absLog10")
#> [1] -3.00000  2.00000 -1.30103  1.00000 -0.30103  0.00000
pScore(testPvals, sign=testPvalSign, method="qnorm")
#> [1] -3.2905267  2.5758293 -1.9599640  1.6448536 -0.6744898  0.0000000
testLog <- rep(c(TRUE, FALSE),3)
pScore(testPvals, testLog, method="absLog10")
#> [1]  3.00000 -2.00000  1.30103 -1.00000  0.30103  0.00000
pScore(testPvals, testLog, method="qnorm")
#> [1]  3.2905267 -2.5758293  1.9599640 -1.6448536  0.6744898  0.0000000

testPvals <- 10^seq(-5, 0, 0.05)
plot(pScore(testPvals, method="qnorm"),
     pScore(testPvals, method="absLog10"),
     xlab="pQnormScore", ylab="pAbsLog10Score"); abline(0,1, col="red", lty=2)
