juDGE plots
To characterize the effect of a treatment — is it mostly driving splicing changes, or general gene expression changes? — splicekit generates juDGE plots: junction logFC vs. gene logFC, one point per gene.
splicekit judge
Plots are written to results/judge/* as PNG images, plus interactive Plotly HTML reports (hover to see the data point and gene name).
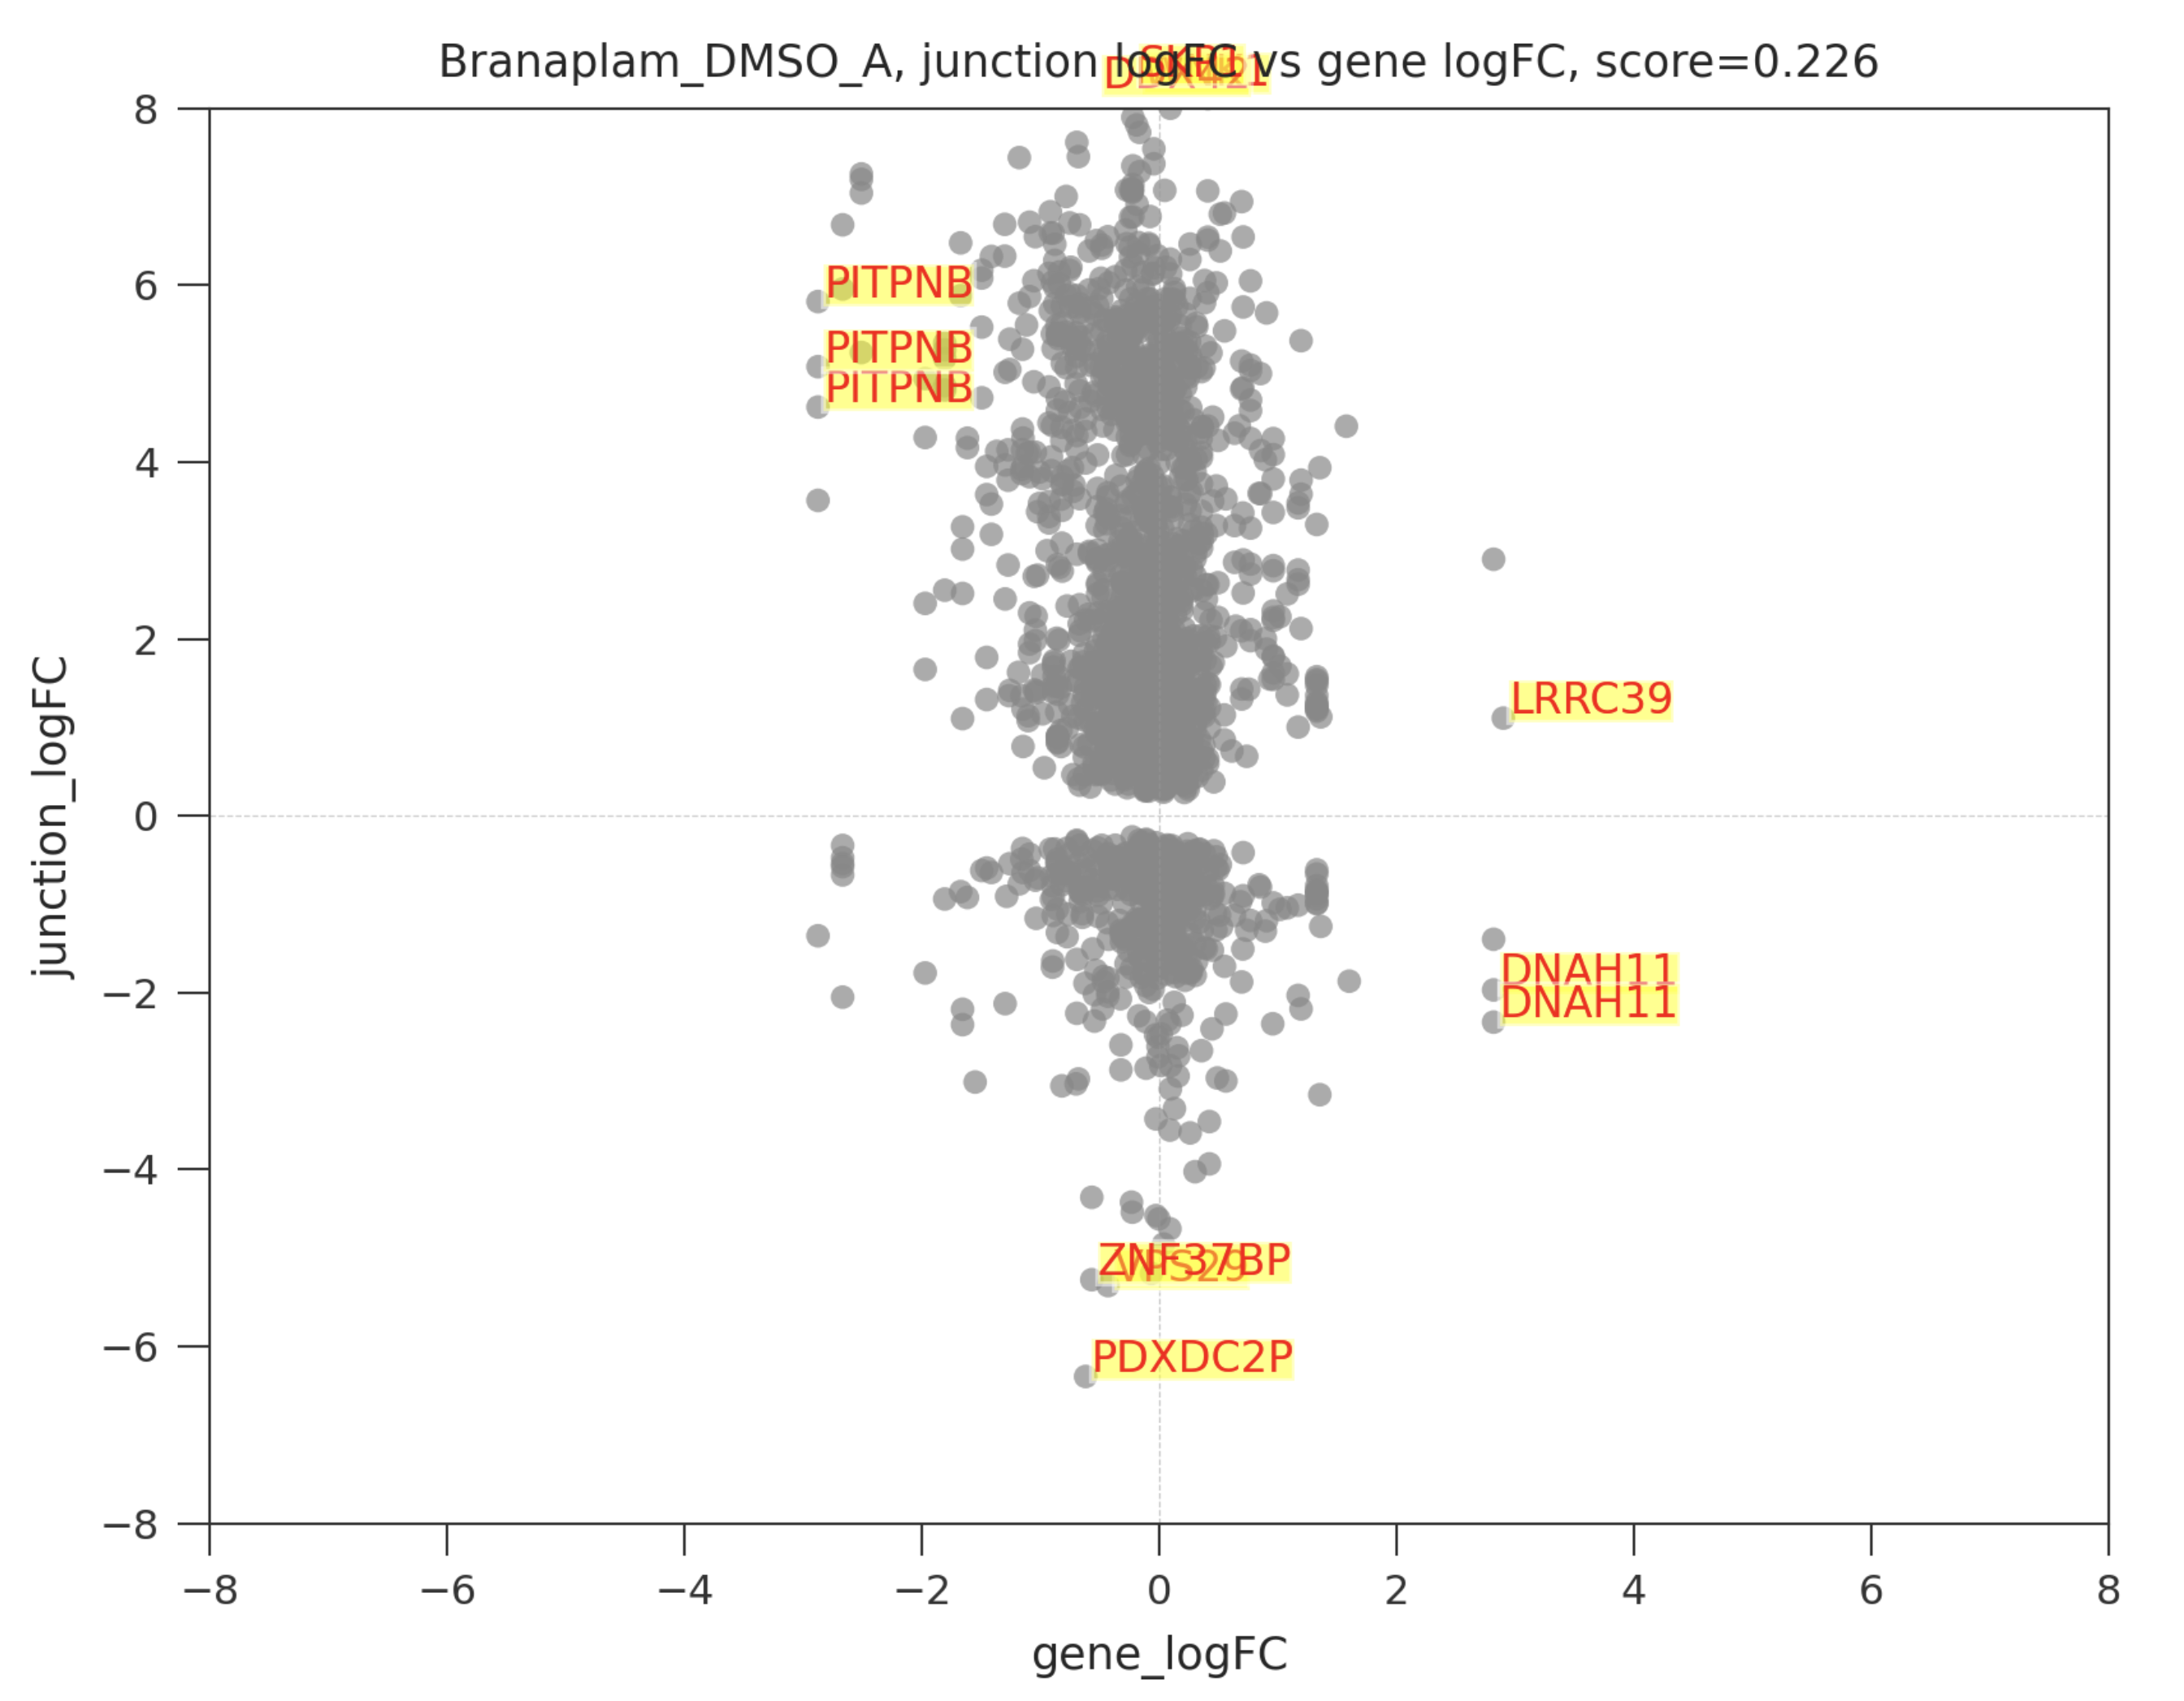
In a plot like the one above, a comparison where junctions (y axis) are perturbed much more than gene expression in general (x axis) is characterized as a "splicing modifier". A comparison with more activity on the x axis — general gene expression — is labeled an "expression modifier".