Note
Click here to download the full example code
plotting gene expression
This example shows you some of the different plots you can use to plot gene expression.
import besca as bc
import pytest

# pytest.skip('Test is only for here as example and should not be executed')
# import data
adata = bc.datasets.Haber2017_processed()
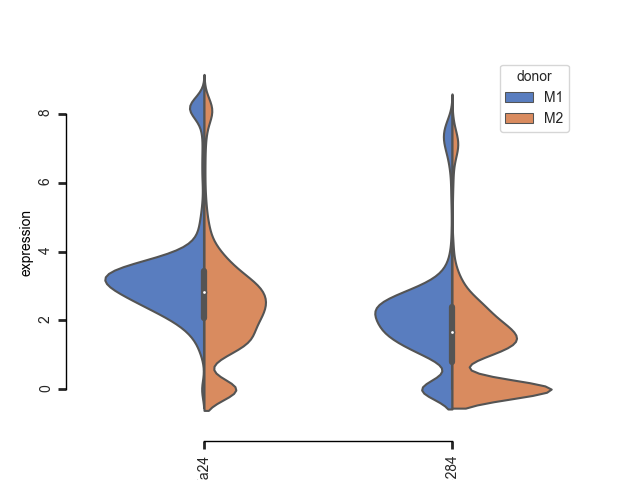
compare two conditions
You can use the split violin plot to compare gene expression for two different conditions.
bc.pl.gene_expr_split(adata, genes=["Defa24", "Gm15284"], split_variable="donor")

use a stacked split violin plot to compare this for several genes at the same time
bc.pl.gene_expr_split_stacked(
    adata=adata,
    genes=["Defa24", "Gm15284"],
    split_variable="donor",
    subset_variable="region_x",
    inner=None,
)
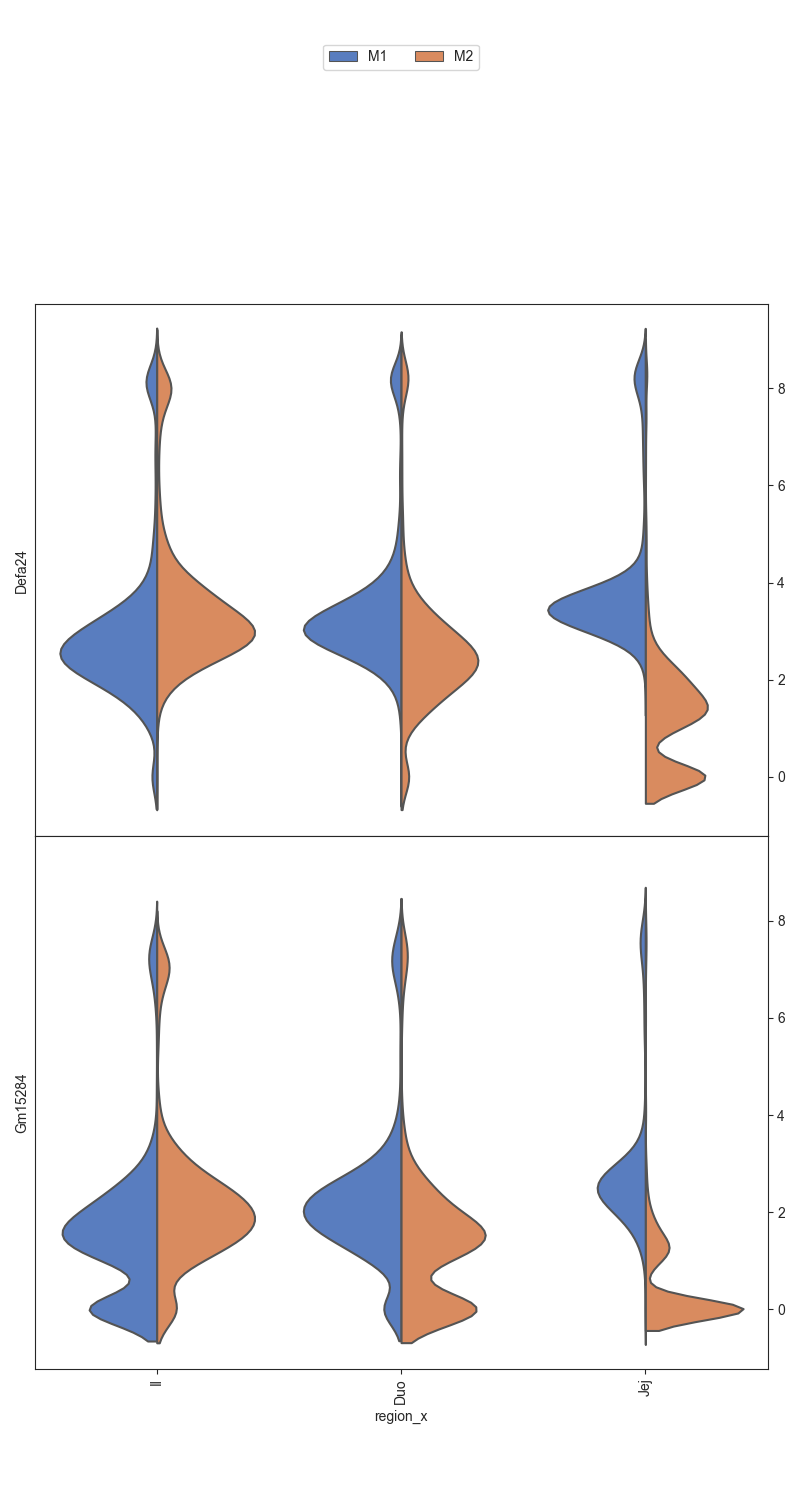
merging a total of  3  datasubset

<Figure size 800x1500 with 2 Axes>
Total running time of the script: ( 0 minutes 1.534 seconds)